Investigating whether geographic proximity to international land borders correlated with different COVID-19 health outcomes.
Project Overview
Themes: Public Health, Global Health, COVID-19 Pandemic, Border Health
Approach: Geospatial Mapping; Data Processing
Status: Complete
Duration: July 2025 – March 2026
Goals
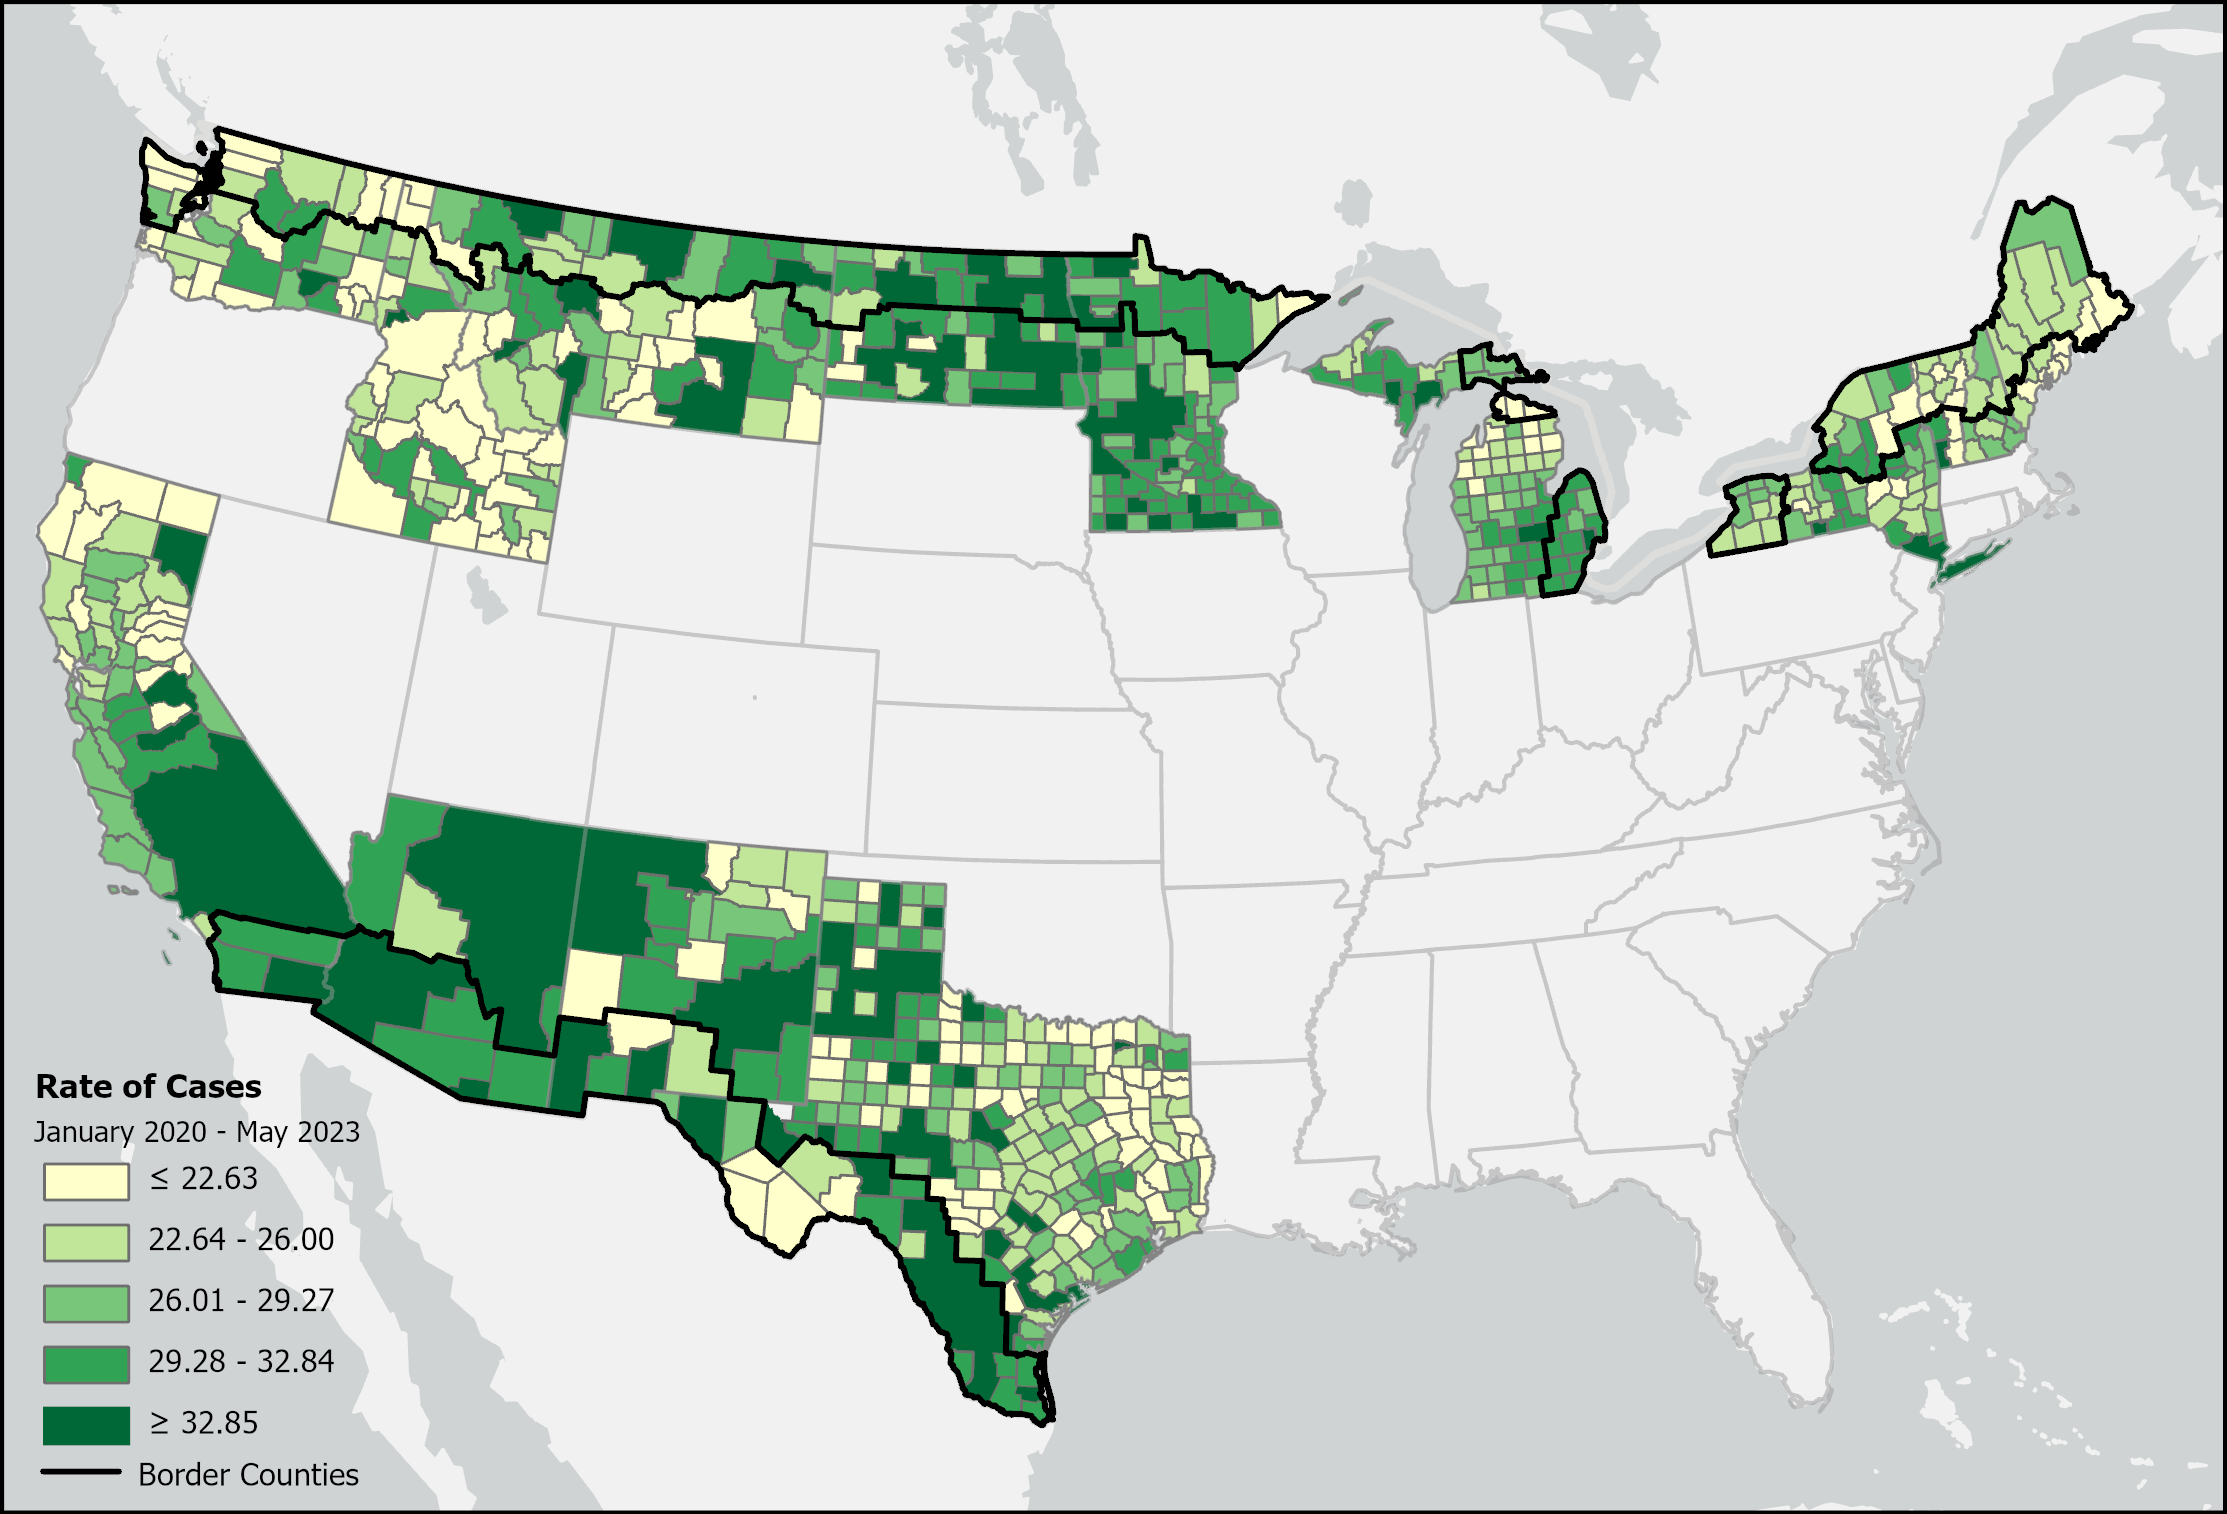
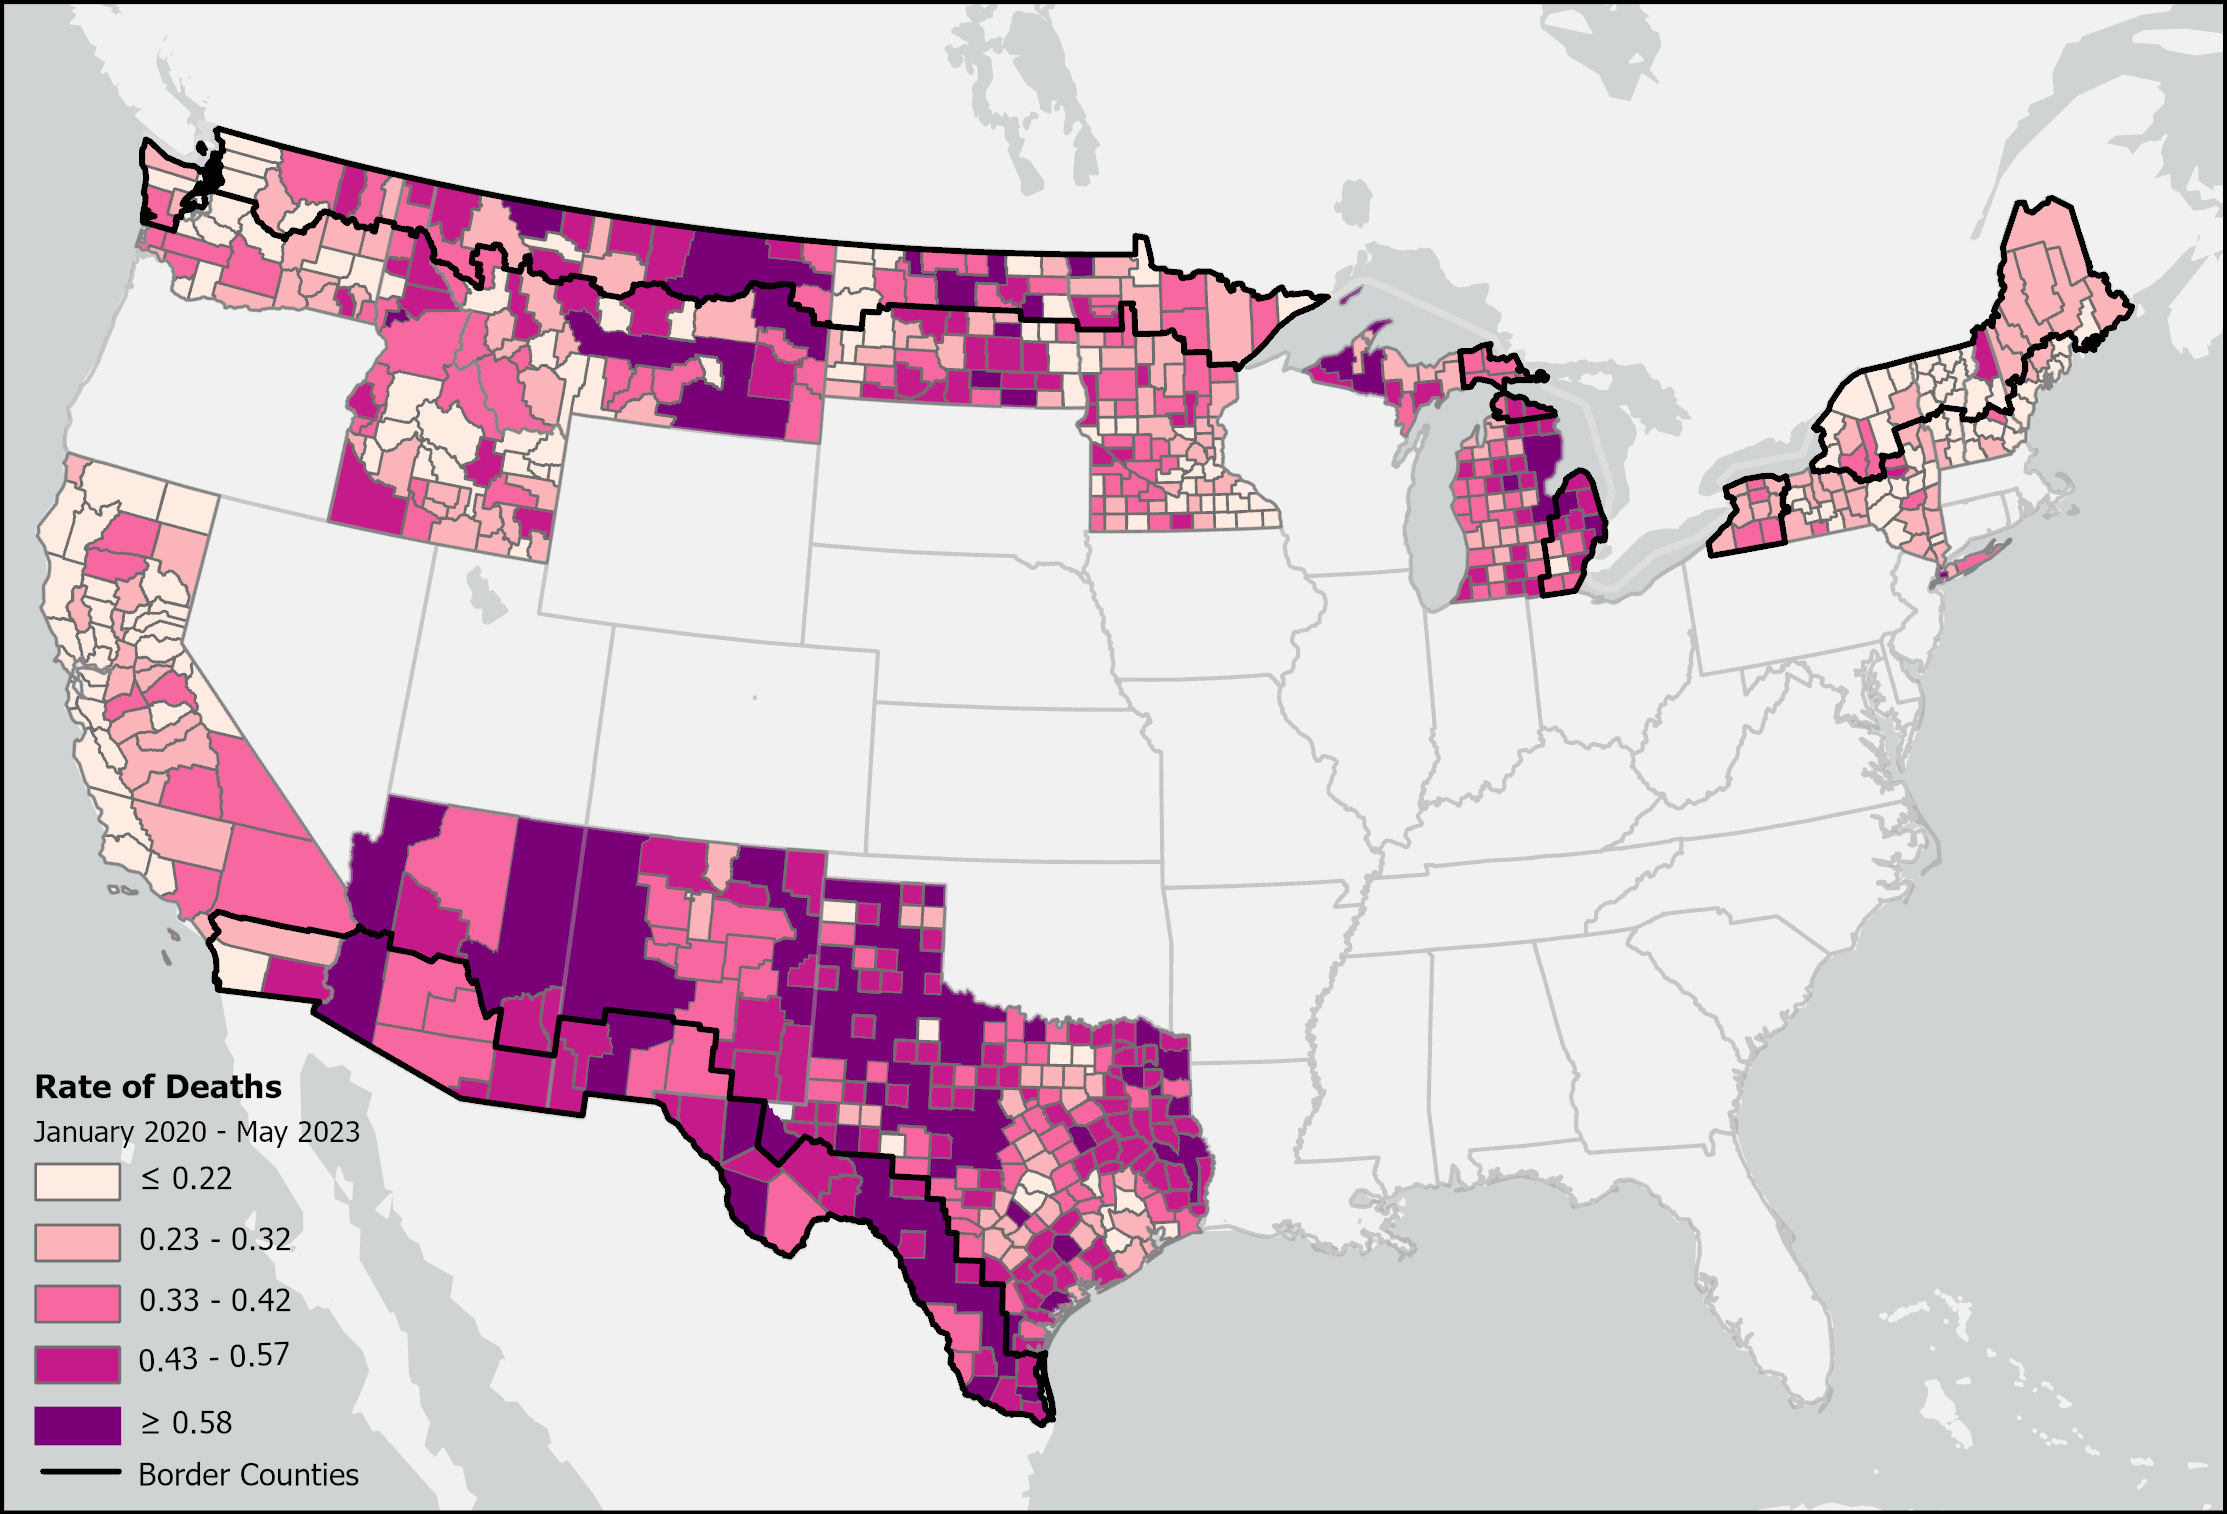
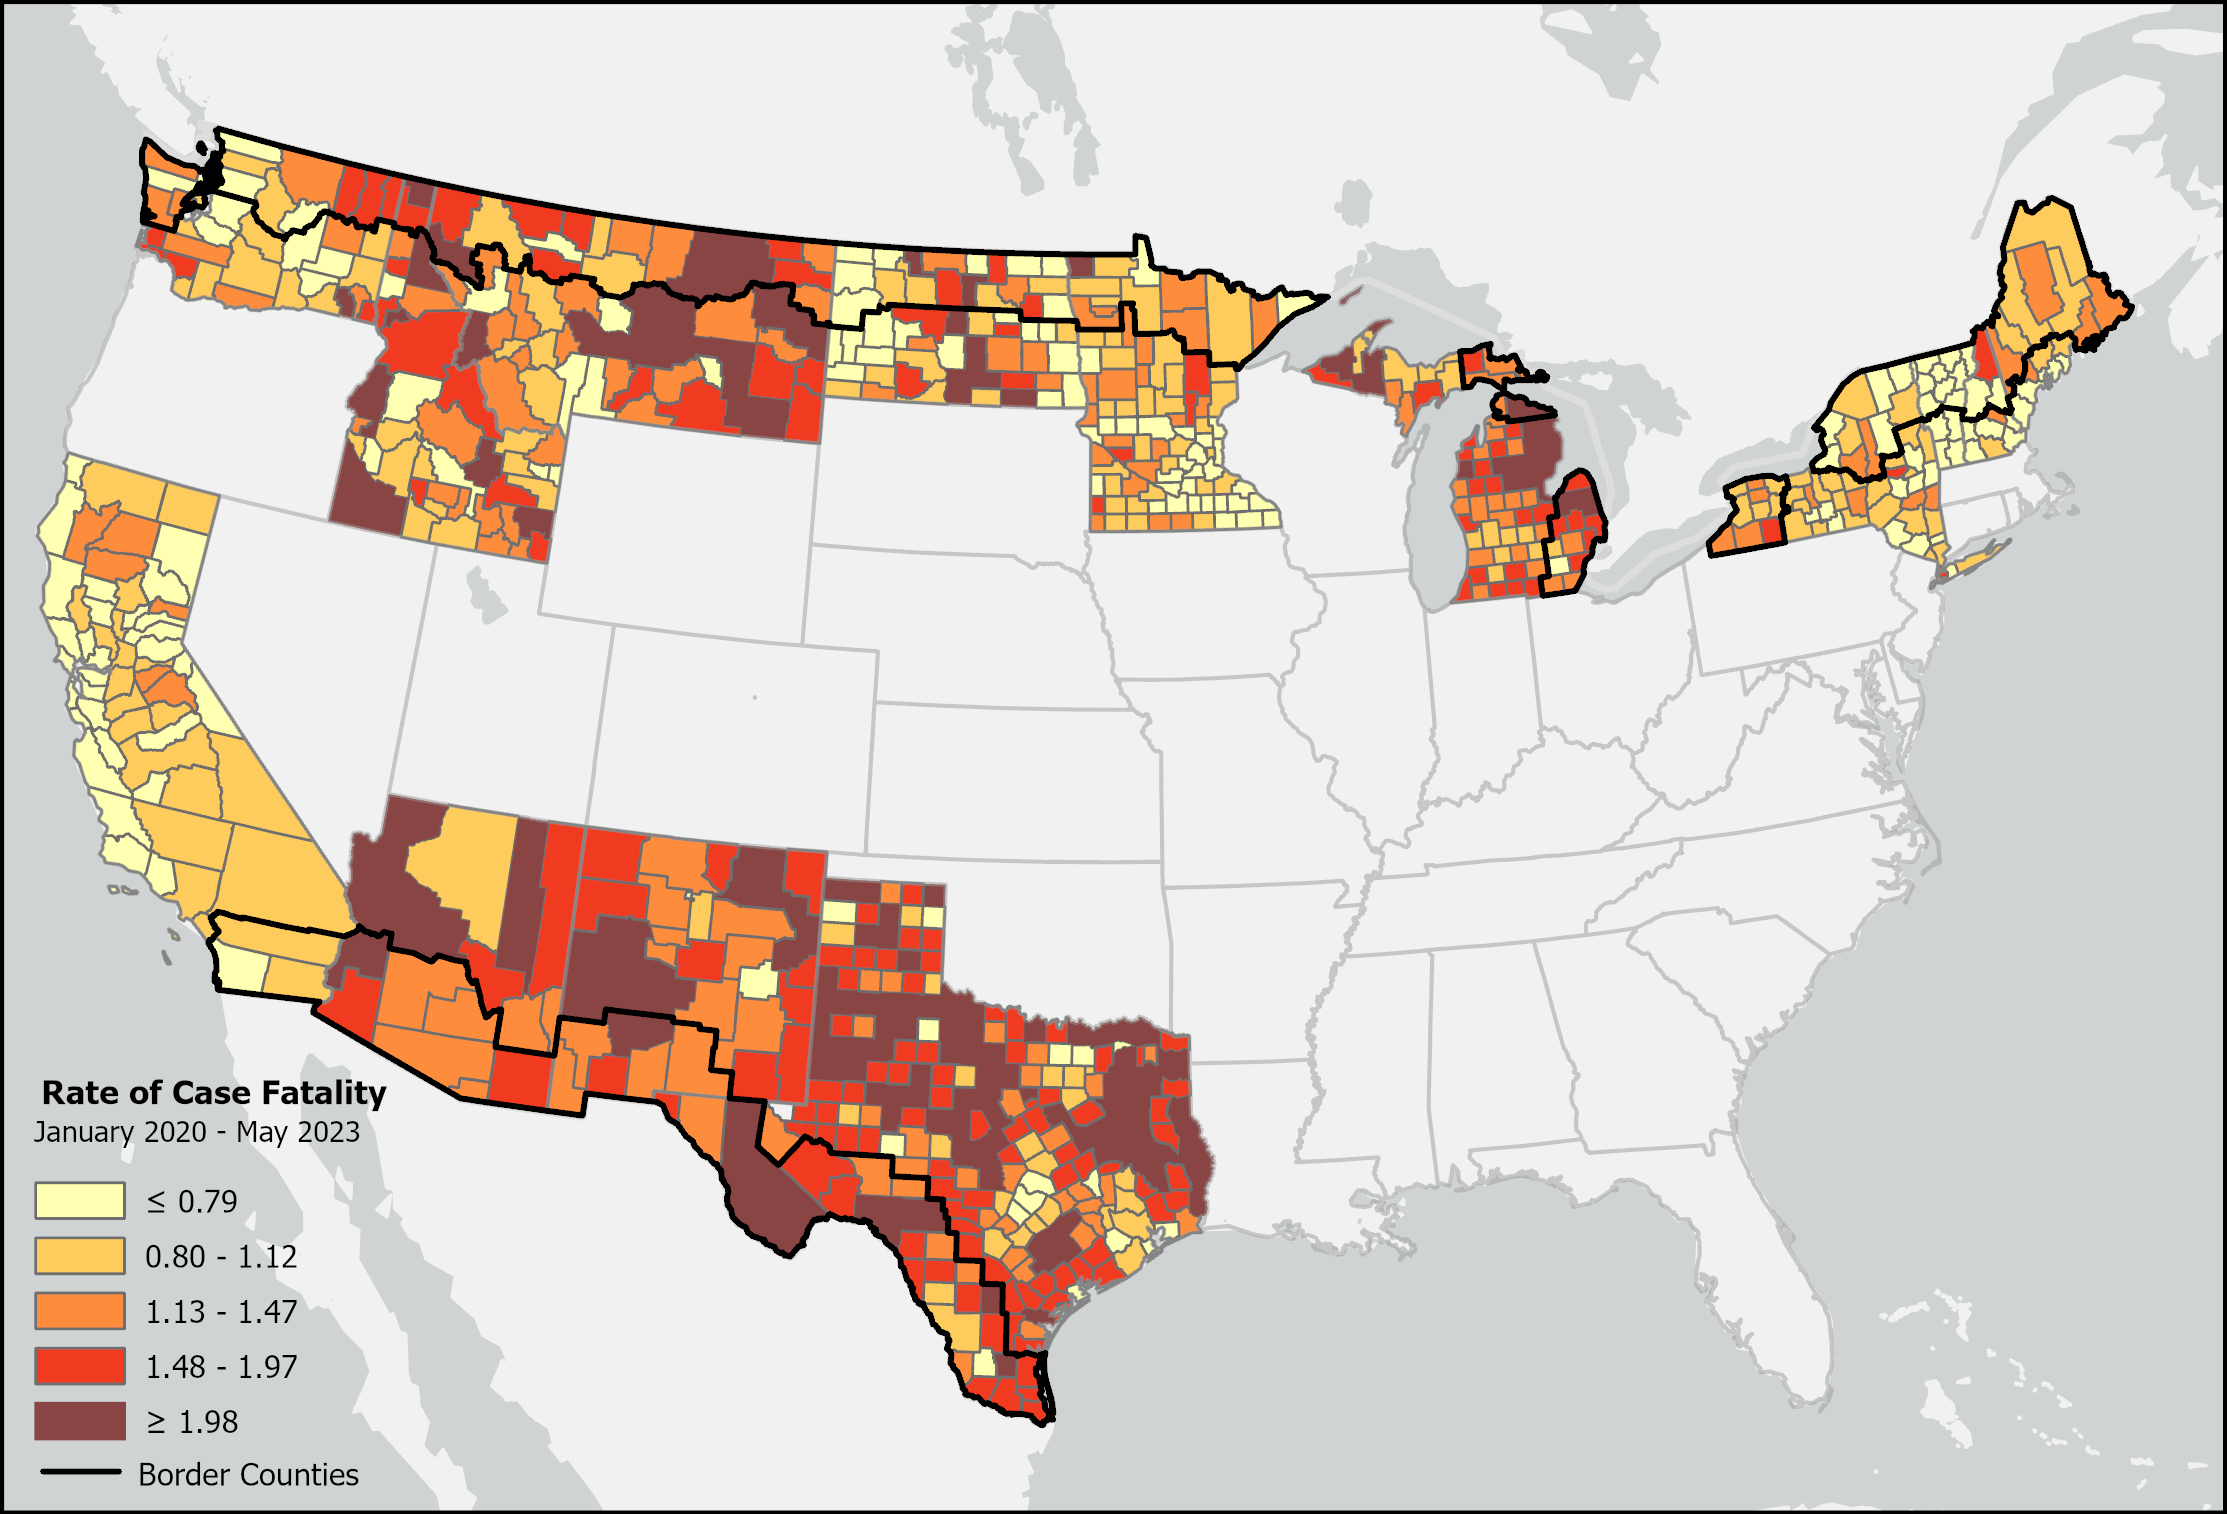
While COVID-19 impacted the entire United States, border regions faced unique public health challenges. The UCR School of Medicine sought to determine if geographic proximity to international land borders (Mexico and Canada) correlated with significantly different health outcomes. The specific objectives were to compare COVID-19 incidence case rate, mortality, and case fatality rates between 1) US-Mexico border counties vs same state non-border counties, 2) US-Canada border counties vs same state non-border counties, and 3) US-Mexico border counties vs US-Canada border counties across the first three and a half years of the COVID-19 pandemic. The Research Services team focused on transforming raw epidemiological data into a geographic analysis that could highlight these regional disparities.
Research Services Contribution
The Research Services Team provided data processing and geospatial mapping support, focusing on three key areas:
Data Cleaning & Processing
Research Services cleaned and processed raw weekly COVID-19 data to produce a dataset ready for analysis. This included aggregating weekly figures into quarterly totals, validating quantities and calculation results, and handling outliers. Finally, the team transformed the dataset into a format compatible with ArcGIS Pro for mapping.
Border Proximity Classification
To analyze the impact of border proximity on COVID-19 outcomes, a binary variable was generated using the Select by Location tool in ArcGIS Pro to classify counties based on whether or not they fell within a distance of 100 km from an international land border.
Geospatial Mapping and Visualization
Geospatial mapping was conducted in ArcGIS Pro software using a shapefile of US counties and TIGER Line international boundaries as spatial data sources. Selected counties were exported from the county data source to create a new map layer containing only border state counties. Tabular COVID-19 data was joined to corresponding spatial features. Visualizations were created for each of the mapped attributes in each time period.
Outcomes
This collaboration resulted in a comprehensive dataset and geospatial visualizations that identified variance in COVID-19 outcomes between US/Mexico and US/Canada border regions at different stages of the pandemic.
This research informs future binational pandemic (and other disaster) preparedness strategies by adding greater geospatial and time context to the question “Did US border regions along the Mexican border have worse COVID-19 related health care outcomes throughout the COVID-19 pandemic?”
Project Partners
Dr. Robert Rodriguez
Lead, UCR School of Medicine
Shaokui Ge, PhD
UCR School of Medicine
Leonides Catarino
UCR School of Medicine
Berenice Arguello
UCSF School of Medicine
Barbara Martinez Neda, PhD
Research Services, UCR Library
Janet Reyes
Research Services, UCR Library